
Line balancing software
Line balancing software with Yamazumi charts
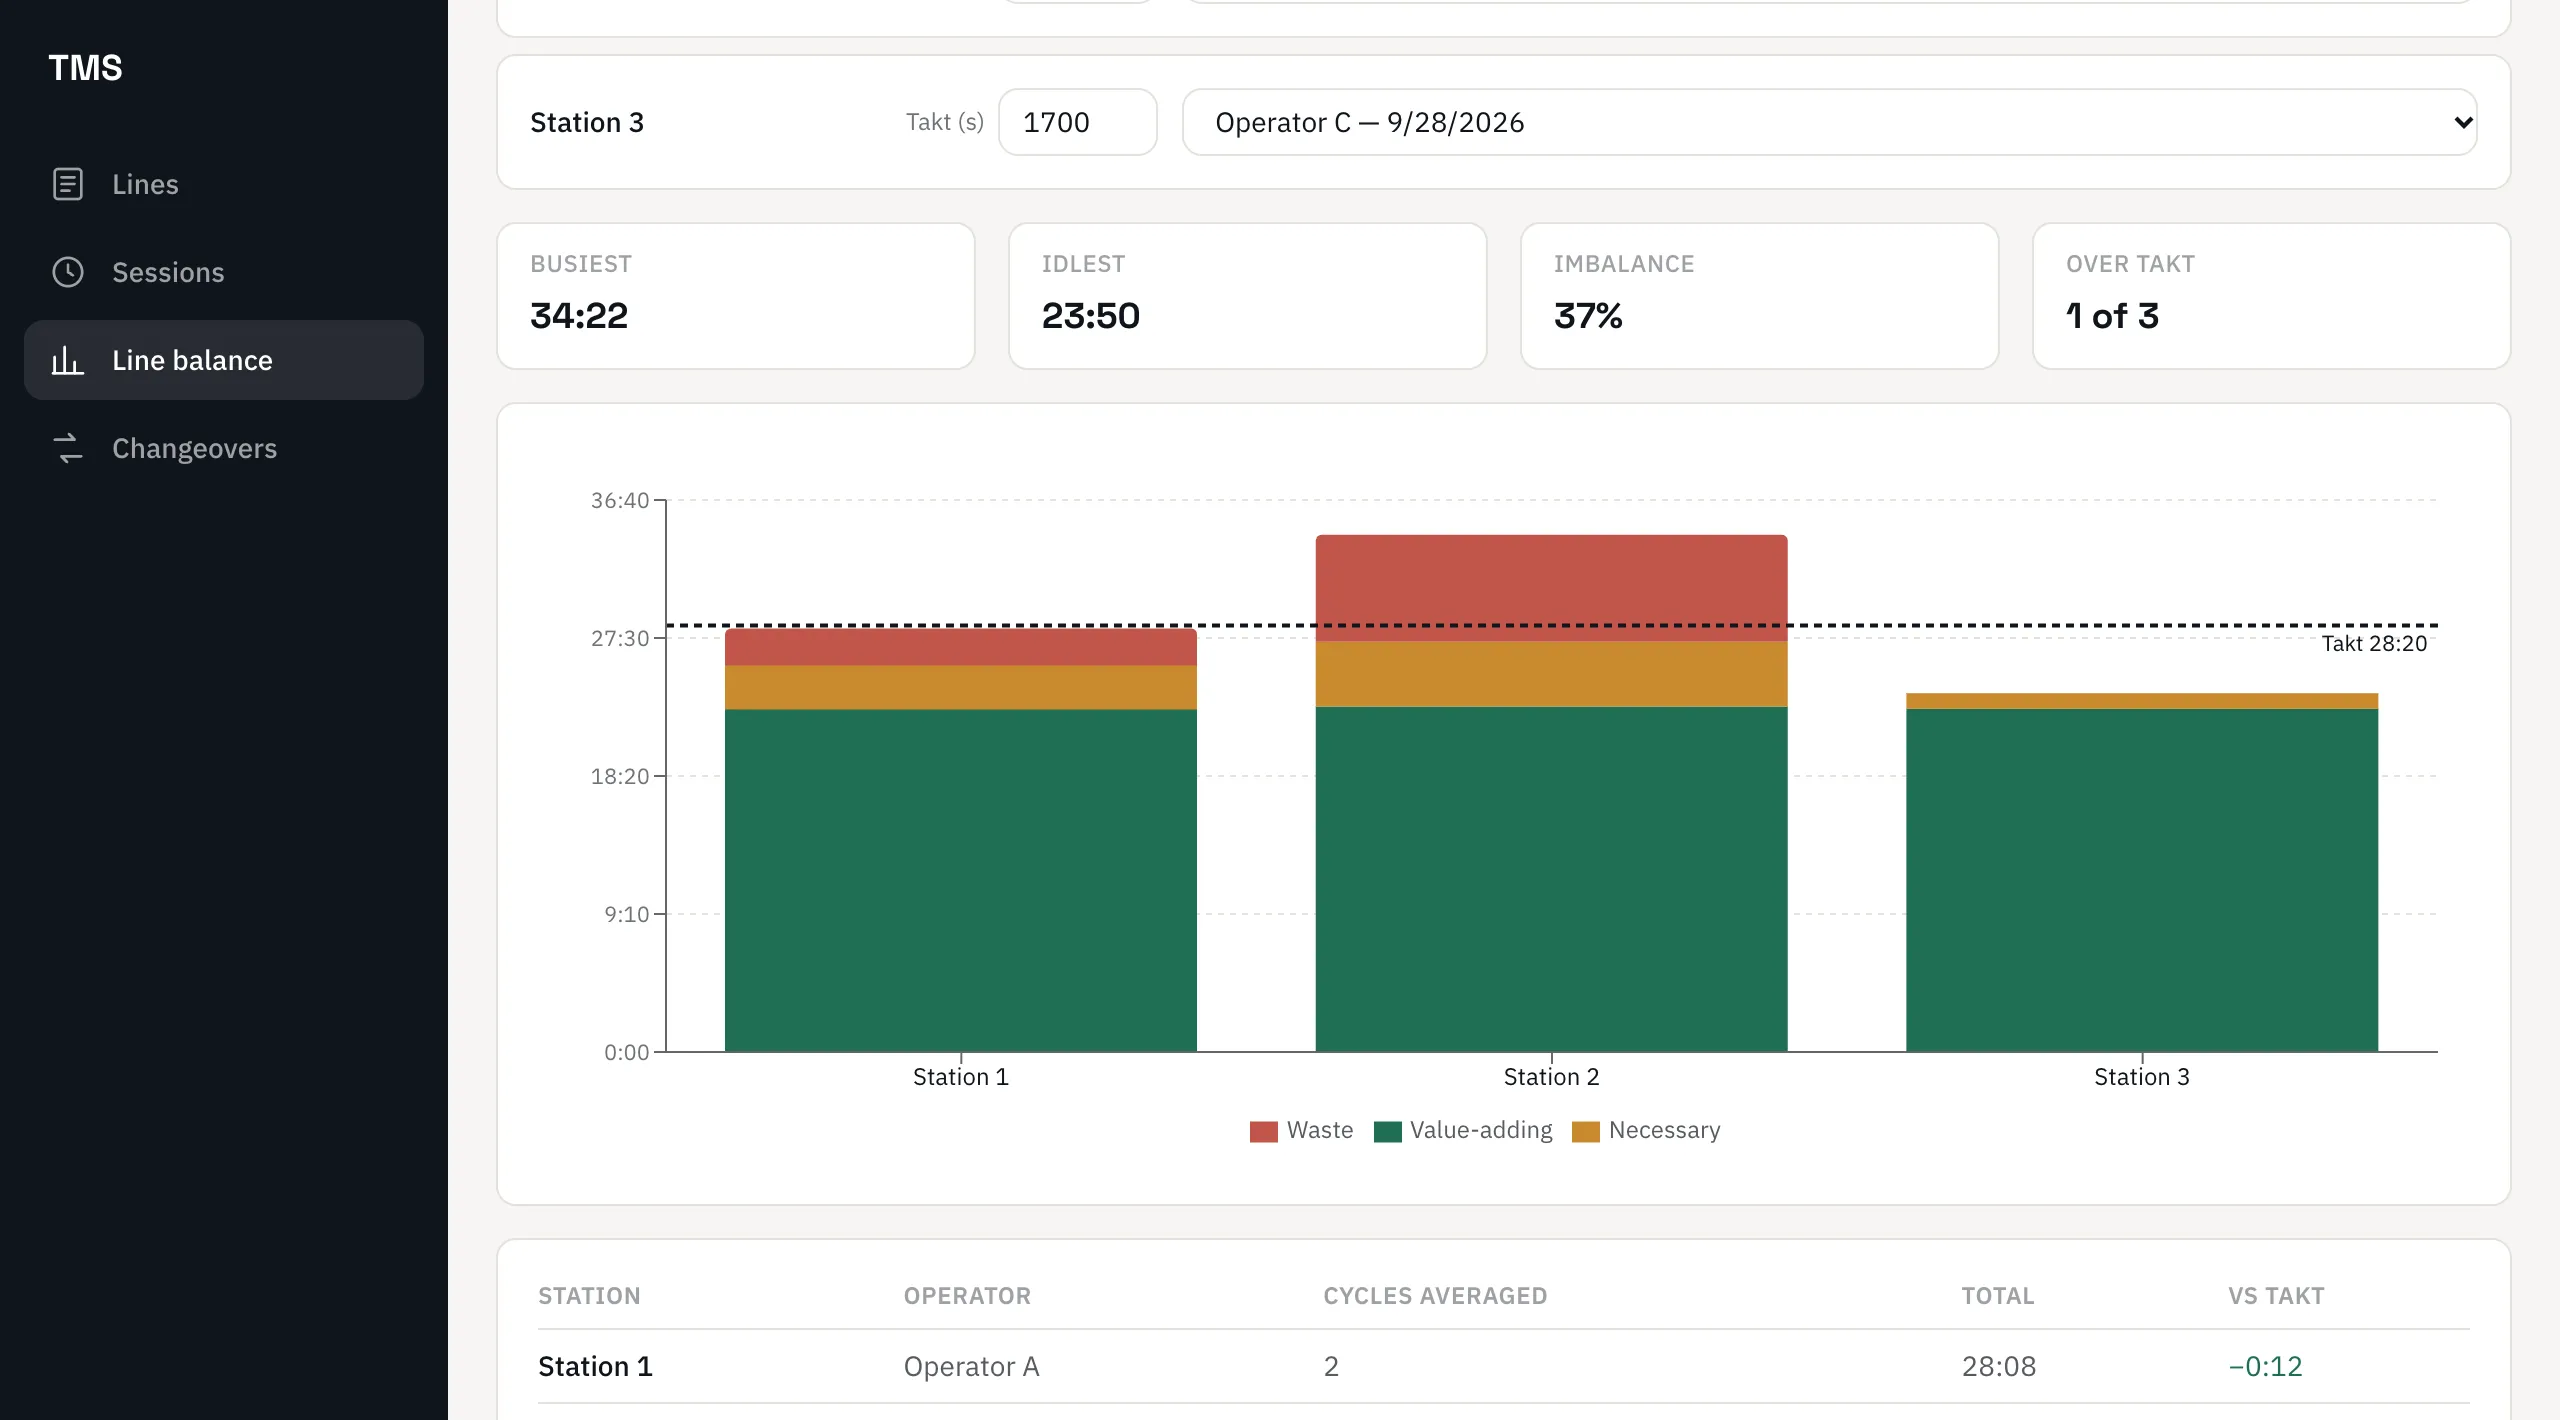
Stack every station’s work against takt time, built directly from your time studies. The bottleneck — and the capacity next to it — is visible at a glance.
The Yamazumi chart should not be a project of its own
Balancing a line by hand means copying cycle times from study sheets into a spreadsheet and redrawing the chart after every change. LeanPad builds the Yamazumi from the time studies you already recorded: pick the session that represents each station, set its takt, and the chart is there.
Features
From time study to balanced line
Built from your time studies
No re-typing. Every session recorded at a station becomes a candidate bar in the chart, with its real cycle times.
Takt time per station
Set the available time per cycle at each station. A dashed line shows takt across the whole line.
Value-adding, necessary, waste
Each bar is stacked by category, so you see whether a station is over takt because of real work or because of waste.
The key numbers, instantly
Busiest station, idlest station, imbalance and how many stations are over takt.
Choose the session that counts
Several operators or shifts at one station? Pick which recording represents it and compare the difference.
A table behind the chart
Station, operator, cycles averaged, total time and the gap to takt — ready for your report.
One chart for the whole line
Each station is one stacked bar. The dashed line is takt. A bar above the line is your bottleneck; the space under the line on its neighbours is where its work can go.
- Bottleneck and over-takt stations highlighted
- Average of the cycles recorded at each station
- Switch the session and see the chart update
Balance a line in four steps
Study each station
Record a time study at every station of the line.
Set takt
Enter the takt time of each station.
Read the Yamazumi
See the bottleneck, the imbalance and the waste per station.
Rebalance and re-measure
Move tasks, remove waste, record again and compare.
LeanPad AIIn development
Rebalancing, suggested by AI
The AI add-on (in development) proposes which tasks to move between stations to flatten the chart, and answers “what if” questions such as adding an operator or changing takt.
- Suggested task moves between stations to flatten the chart against takt
- Ask “what if” in plain language — add an operator, change takt — and get the recalculated line
See it on your own process
In 30 minutes we show you the tools on a line like yours, answer your questions and tell you honestly whether they fit.
Frequently asked questions
What is line balancing software?
Line balancing software compares the work content of each station of a production line with takt time, so that tasks can be redistributed and no station is overloaded or idle. LeanPad does it with a Yamazumi chart built from real time studies.
What is a Yamazumi chart?
A Yamazumi chart is a stacked bar chart with one bar per station or operator. Each bar stacks the work elements of the cycle, usually split into value-adding, necessary and waste, and is compared with a horizontal takt line.
What is takt time?
Takt time is the available production time divided by customer demand: the pace at which one unit must be completed. A station whose cycle time is above takt cannot keep up with demand.
Do I need the Time Study module?
Yes. Line Balancing is an add-on: it uses the sessions recorded with Time Study, so the chart always reflects measured times.
Can I compare operators or shifts at the same station?
Yes. When a station has several recordings, you choose which one represents it, and the chart and the figures update immediately.
Other LeanPad solutions
The tools share the same devices and data, so each one makes the next more useful.
Time Study
Capture value-adding, necessary and waste time on a tablet while you watch the operator — or tag it afterwards against a video. Learn more →
SMED Changeover
Time every changeover task, split internal (machine stopped) from external (machine running), and see what to convert first. Learn more →
Ergonomic Assessments (REBA, RULA, NIOSH)
Score postures and lifting tasks with the standard methods, with photo and video evidence attached to each assessment. Learn more →
See your line on a Yamazumi chart
Book a demo and we will build the chart for one of your lines with you.
See it on your own process
Book a demo